
One of the main questions that the client ask is how many simultaneous visitors can the site handle. Well, we are all know that this is a very general question and can be affected by many factors. To state our client's question in a more technical view, let say this:
We want to check our web server responsiveness when many simultaneous requests hit on it.
There several nice tools to do this (free or commercial). I am going to present a free one: The old good friend, the httperf by HP.
In addition, I am going to show two relative products that used to show the results in a graph view:
- The autobench by Xenoclast. Autobench is a simple Perl script for automating the process of benchmarking a web server (or for conducting a comparative test of two different web servers). The script is a wrapper around httperf.
- The bench2graph. bench2graph takes a TSV format autobench results file, and uses gnuplot to graph the results, producing output in Postscript. It comes with the autobench package. It requires gnuplot package.
Installing Httpref
If you try to install httpref using the method Code Download, Compile & Install (or via a package manager), it is possible (depending on your setup environment) to phase the following well known error message:httperf: warning: open file limit > FD_SETSIZE; limiting max. # of open files to FD_SETSIZE
In order to see what is you current value of the constant, enter this command:
[ajv@localhost ~]$ ./httperf -v
httperf --verbose --client=0/1 --server=localhost --port=80 --uri=/ --send-buffer=4096 --recv-buffer=16384 --num-conns=1 --num-calls=1
httperf: maximum number of open descriptors = 1024
Maximum connect burst length: 0
...
The error described above is because, while the program runs, the number of open files becomes greater than the maximum number of open files allowed by the OS. What we have to do to solve the problem is to change this number on some Constants in two header files, and re-perform the compile and install. The constants that we are looking for is the FD_SETSIZE. We run the command:
[ajv@localhost ~]$ grep -R FD_SETSIZE /usr/include/*
/usr/include/bits/posix1_lim.h:# define _POSIX_FD_SETSIZE _POSIX_OPEN_MAX
/usr/include/bits/typesizes.h:#define __FD_SETSIZE 1024
/usr/include/linux/posix_types.h:#undef __FD_SETSIZE
/usr/include/linux/posix_types.h:#define __FD_SETSIZE 1024
/usr/include/linux/posix_types.h:#define __FDSET_LONGS (__FD_SETSIZE/__NFDBITS)
/usr/include/linux/time.h:#define FD_SETSIZE __FD_SETSIZE
/usr/include/sys/select.h: __fd_mask fds_bits[__FD_SETSIZE / __NFDBITS];
/usr/include/sys/select.h: __fd_mask __fds_bits[__FD_SETSIZE / __NFDBITS];
/usr/include/sys/select.h:#define FD_SETSIZE __FD_SETSIZE
[ajv@localhost ~]$
As we can see, there are only two header files that we have to edit. We can change the default value 1024 to a greater, say 32768. Remember to use sudo when you edit the files, for example enter this command:
[ajv@localhost ~]$ sudo vi /usr/include/bits/typesizes.hWhen you change the above values, do the compilation (as root) the normal way:
[ajv@localhost ~]$ sudo -s
[root@localhost ~]# wget ftp://ftp.hpl.hp.com/pub/httperf/httperf-0.9.0.tar.gz
[root@localhost ~]# tar -xvf httperf-0.9.0.tar.gz
[root@localhost ~]# cd httperf-0.9.0
[root@localhost ~]# ./configure
[root@localhost ~]# ./make
[root@localhost ~]# ./make install
Notes
- After the last step the final executable will be putted in /usr/local/bin/
- The above statements will produce as output a lot of lines that I skip them to save space.
- Normally you can finish the above steps without any error, unless you don't have correctly setup your distro for development. If you face problems please follow this link to setup your developer environment correctly. ;)
- A full documentation in PDF format about httperf you can find here.
- Modify as a root the file /etc/security/limits.conf by adding the following lines (suppose the username is user1):
user1 soft nofile 32768
user1 hard nofile 32768
then logout and login again.
- In addition, try the command ulimit :
[ajv@localhost ~]$ ulimit -s 32768
[ajv@localhost ~]$ ulimit -s
32768
Installing Autobench
There is a tool that works above httperf and provides easy process and better output capabilities than the httpperf itself: Autobech.Autobench is a simple Perl script for automating the process of benchmarking a web server (or for conducting a comparative test of two different web servers). The script is a wrapper around httperf. Autobench runs httperf a number of times against each host, increasing the number of requested connections per second on each iteration, and extracts the significant data from the httperf output, delivering a CSV or TSV format file which can be imported directly into a spreadsheet for analysis/graphing [source].
To download, compile and install autobench follow the obvious way:
[ajv@localhost ~]$ sudo -s
[root@localhost ~]# wget http://www.xenoclast.org/autobench/autobench-2.1.2.tar.gz
[root@localhost ~]# tar -xvf autobench-2.1.2.tar.gz
[root@localhost ~]# cd autobench-2.1.2
[root@localhost ~]# ./configure
[root@localhost ~]# ./make
[root@localhost ~]# ./make install
For your convenience, you can make a link in your home ~ dir:
[ajv@localhost ~]$ ln -s /usr/local/bin/autobench ~/autobench
and
[ajv@localhost ~]$ ln -s /usr/local/bin/bench2graph ~/bench2graph
Please note that the last requires the gnuplot package, so in case that you don't already install it just type:
[ajv@localhost ~]$ sudo yum install gnuplot
Autobench in action
I will provide to you a sample command for running autobench (following by a detailed analysis) but first let me describe my test lab environment.I have setup the above sofware in a CentOS 6.5 x32 distro in a VMWare virtual machine on a host hardware HP ProBook 6560b laptop core i5 with 6Gb of main RAM. The VM resources takes 1Gb of RAM with 1 virtual processor and 20Gb of virtual hdd.
The Host OS is a Windows 7 Pro x64. In this system I have setup the test web servers: It is the build in IIS 7 run on port 80 and I have also setup an Apache (WAMP) server that run on port 8001.
For the matter of test I have created the following script file (called run.autobench) :
#!/bin/bashThe script file takes two parameters: the target IP and the corresponding PORT that the web server is running. An example of the actual command is the following:
if [ "$#" -ne 2 ]; then
echo "Illegal number of parameters"
echo "Usage: run.autobench <IP> <Port>"
else
autobench --single_host --host1 $1 --uri1 /index.html port1 $2 --quiet --low_rate 20 --high_rate 600 --rate_step 20 --num_call 10 --num_conn 24000 --timeout 3 --file out_$1.tsv
fi
[ajv@localhost ~]$ ./autobench 192.168.1.5 80
The parameters I used are the following:
--single_host
to make a test against a single host.
--host1 $1
the IP of the host to be tested.
--uri1 /index.html
the filename if the file of the server to be tested.
port1 $2
the port of the host to be tested.
--quiet eliminate the information messages.
--low_rate 20
the minimum number of connection to open per second.
--high_rate 600
the minimum number of connection to open per second.
--rate_step 20
the number of connections to be added in each iteration.
--num_call 10
is the number of requests per connection.
--num_conn 24000
is the total number of connections to make during a test
--timeout 3
the maximimum time (in seconds) that httperf will wait for replies from the web server.
--file out_$1.tsv
the results are written to an ascii file (out_<IP> and tsv extension) in order to be taken as input to bench2graph program in a later stage.
After running the above command a file named out_192.168.1.5.tsv is created with information about the specific web server responses findings. A such file can contain the following data:
dem_req_rate req_rate_testhost con_rate_testhost min_rep_rate_testhost avg_rep_rate_testhost
max_rep_rate_testhost stddev_rep_rate_testhost resp_time_testhost net_io_testhost errors_testhost
200 199.3 19.9 182.0 199.7 200.6 2.6 90.0 243.7 0
300 298.4 29.8 273.8 299.2 300.6 4.6 90.0 364.9 0
400 397.2 39.7 364.7 398.6 401.8 7.1 90.1 485.7 0
500 495.7 49.6 454.9 497.8 501.8 10.1 90.1 606.0 0
600 593.7 59.4 546.0 596.7 601.8 13.6 90.1 725.9 0
700 691.5 69.1 637.6 695.6 700.2 16.7 90.1 845.5 0
800 788.8 78.9 728.6 794.1 802.8 20.7 90.1 964.4 0
900 885.9 88.6 819.5 892.8 900.4 24.3 90.2 1083.2 0
1000 982.5 98.3 910.6 991.1 1008.2 28.8 90.2 1201.3 0
1100 1078.8 107.9 1001.7 1089.1 1101.2 32.8 90.2 1319.0 0
1200 1175.0 117.5 1092.6 1186.5 1200.4 38.0 90.5 1436.6 0
1300 1270.4 127.0 1182.5 1283.1 1312.3 44.9 90.6 1553.3 0
1400 1365.8 136.6 1273.3 1381.7 1401.1 47.8 91.4 1669.9 0
1500 1459.3 145.9 1341.9 1474.6 1505.1 65.1 100.8 1784.2 0
1600 1549.5 155.0 1414.9 1561.9 1607.7 72.6 124.2 1894.5 0
1700 1619.9 162.0 1443.8 1628.7 1726.8 96.6 212.4 1980.6 0
1800 1580.3 158.3 1478.3 1656.2 1757.1 100.2 282.6 1932.2 0.016025641025641
1900 1636.8 165.6 1481.0 1646.9 1759.6 118.4 300.1 2001.2 0.115314586283633
2000 1641.5 173.0 1502.6 1659.1 1741.4 94.3 312.5 2006.9 0.53740779768177
The above data can feed the bench2graph program in order for the tester to get a graph image. To transform the data into a graph I will execute the following command:
[ajv@localhost ~]$ ./bench2graph out_192.168.1.5.tsv out_imageThe program takes two arguments: the input file (with the numbers to be processed) and the output file (the graph). After I run the program I can see the out_image using the nautilus file manager.
The image of my test can be seen below:
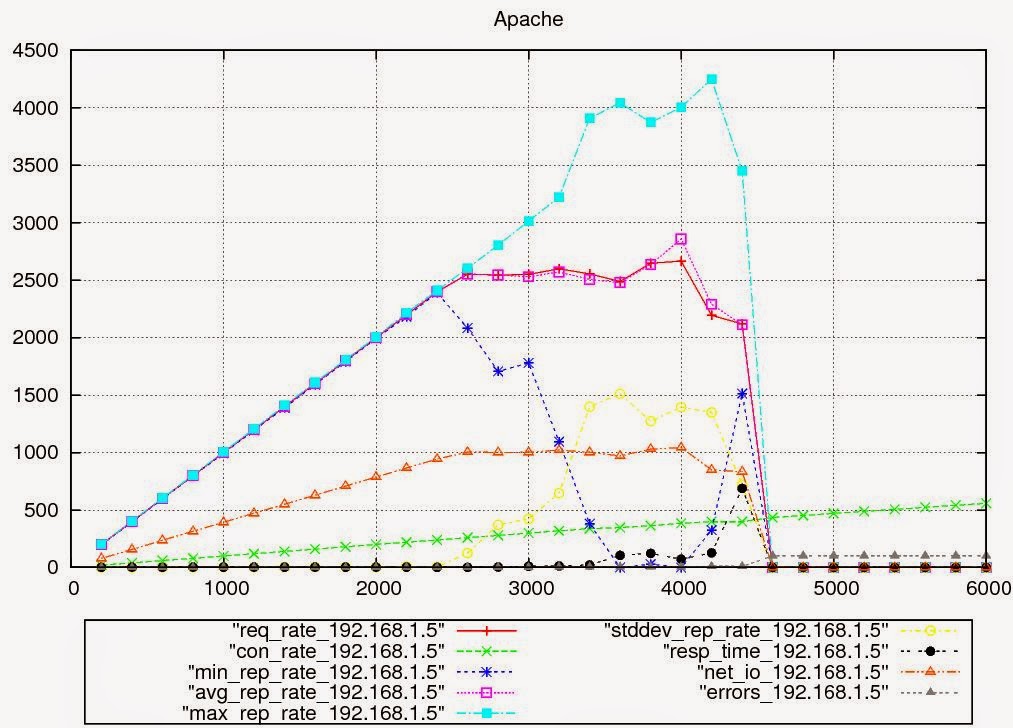 |
| Apache web server test |
We can see that the Apache web server under test became saturated at around 2500 requests per second (250 connections per second, since 10 requests are sent down each connection).
 |
| IIS7 web server test |
Run httperf as a standalone application
We can of course run httperf as a standalone application, without the autobench and bench2graph help. The output is somehow raw, but provides useful information. My script file is the following (called run.httperf) :#!/bin/bashA sample run can be seen below.
if [ "$#" -ne 2 ]; then
echo "Illegal number of parameters"
echo "Usage: run.autobench <IP> <Port>"
else
httperf --server $1 --port $2 --uri /index.html --num-conn 24000 --timeout 3
fi
[ajv@localhost ~]$ ./run.httperf 192.168.1.5 80
httperf --timeout=3 --client=0/1 --server=192.168.1.5
--port=80 --uri=/index.html --send-buffer=4096 --recv-buffer=16384
--num-conns=24000 --num-calls=1
Maximum connect burst length: 1
Total: connections 24000 requests 24000 replies 23999
test-duration 402.663 s
Connection rate: 59.6 conn/s (16.8 ms/conn, <=1
concurrent connections)
Connection time [ms]: min 0.7 avg 16.7 max 2885.5
median 2.5 stddev 49.3
Connection time [ms]: connect 1.8
Connection length [replies/conn]: 1.000
Request rate: 59.6 req/s (16.8 ms/req)
Request size [B]: 74.0
Reply rate [replies/s]: min 5.0 avg 59.5 max 73.8
stddev 8.3 (80 samples)
Reply time [ms]: response 14.8 transfer 0.0
Reply size [B]: header 246.0 content 83.0 footer 0.0
(total 329.0)
Reply status: 1xx=0 2xx=23999 3xx=0 4xx=0 5xx=0
CPU time [s]: user 120.60 system 277.23 (user 30.0%
system 68.8% total 98.8%)
Net I/O: 23.5 KB/s (0.2*10^6 bps)
Errors: total 1 client-timo 1 socket-timo 0
connrefused 0 connreset 0
Errors: fd-unavail 0 addrunavail 0 ftab-full 0 other 0
Conclusions
As David Mosberger, the creator of program noted (and I personally 100% agree), we must never get quick decisions when we measure performance. Always check and double-check the tests and the results before you end up with any conclusion. This is also, what David said about some bugs:BUGS:
Probably many. Always be sure to double−check results and don’tfall preytomeasuring client−perfor-mance instead of server performance!The user−interface definitely could be improved. Asimple workload description language might be moresuitable than the dozens of little command−line options the tool has right now.
References
[1] Nginx HTTP Server - Second Edition[2] http://www.hpl.hp.com/hosted/linux/mail-archives/httperf/2003-December/000128.html
[3] http://www.xenoclast.org/autobench/
[4] http://www.hpl.hp.com/research/linux/httperf/httperf-man-0.9.pdf
[5] http://www.hpl.hp.com/research/linux/httperf/
No comments:
Post a Comment
Note: Only a member of this blog may post a comment.